Reviewing The Data That Has Been Recorded For A Session
Overview
Rockit is all about making the most of the data that you collect and turning it into meaningful information that can be learnt from long after its original collection.
Rockit allows you to review most of the data as its collected. That was part of the rationale behind creating Rockit we wanted to be able to react in real time to the trends in the information.
But we also appreciate that its useful to be able to dig down into the data after the event. Consequently we developed two versions of the screens to review the data collected.
The version on the Rockit Server is designed to be displayed on a 7inch screen. The size of screen that the Rockit Server Device comes equipped with. The Rockit Desktop Analytics have a more expansive layout designed to be viewed on a Laptop screen. They both display the same information but the layout is different.
The Rockit Server version also has the control buttons and fields to start and stop the collection process.
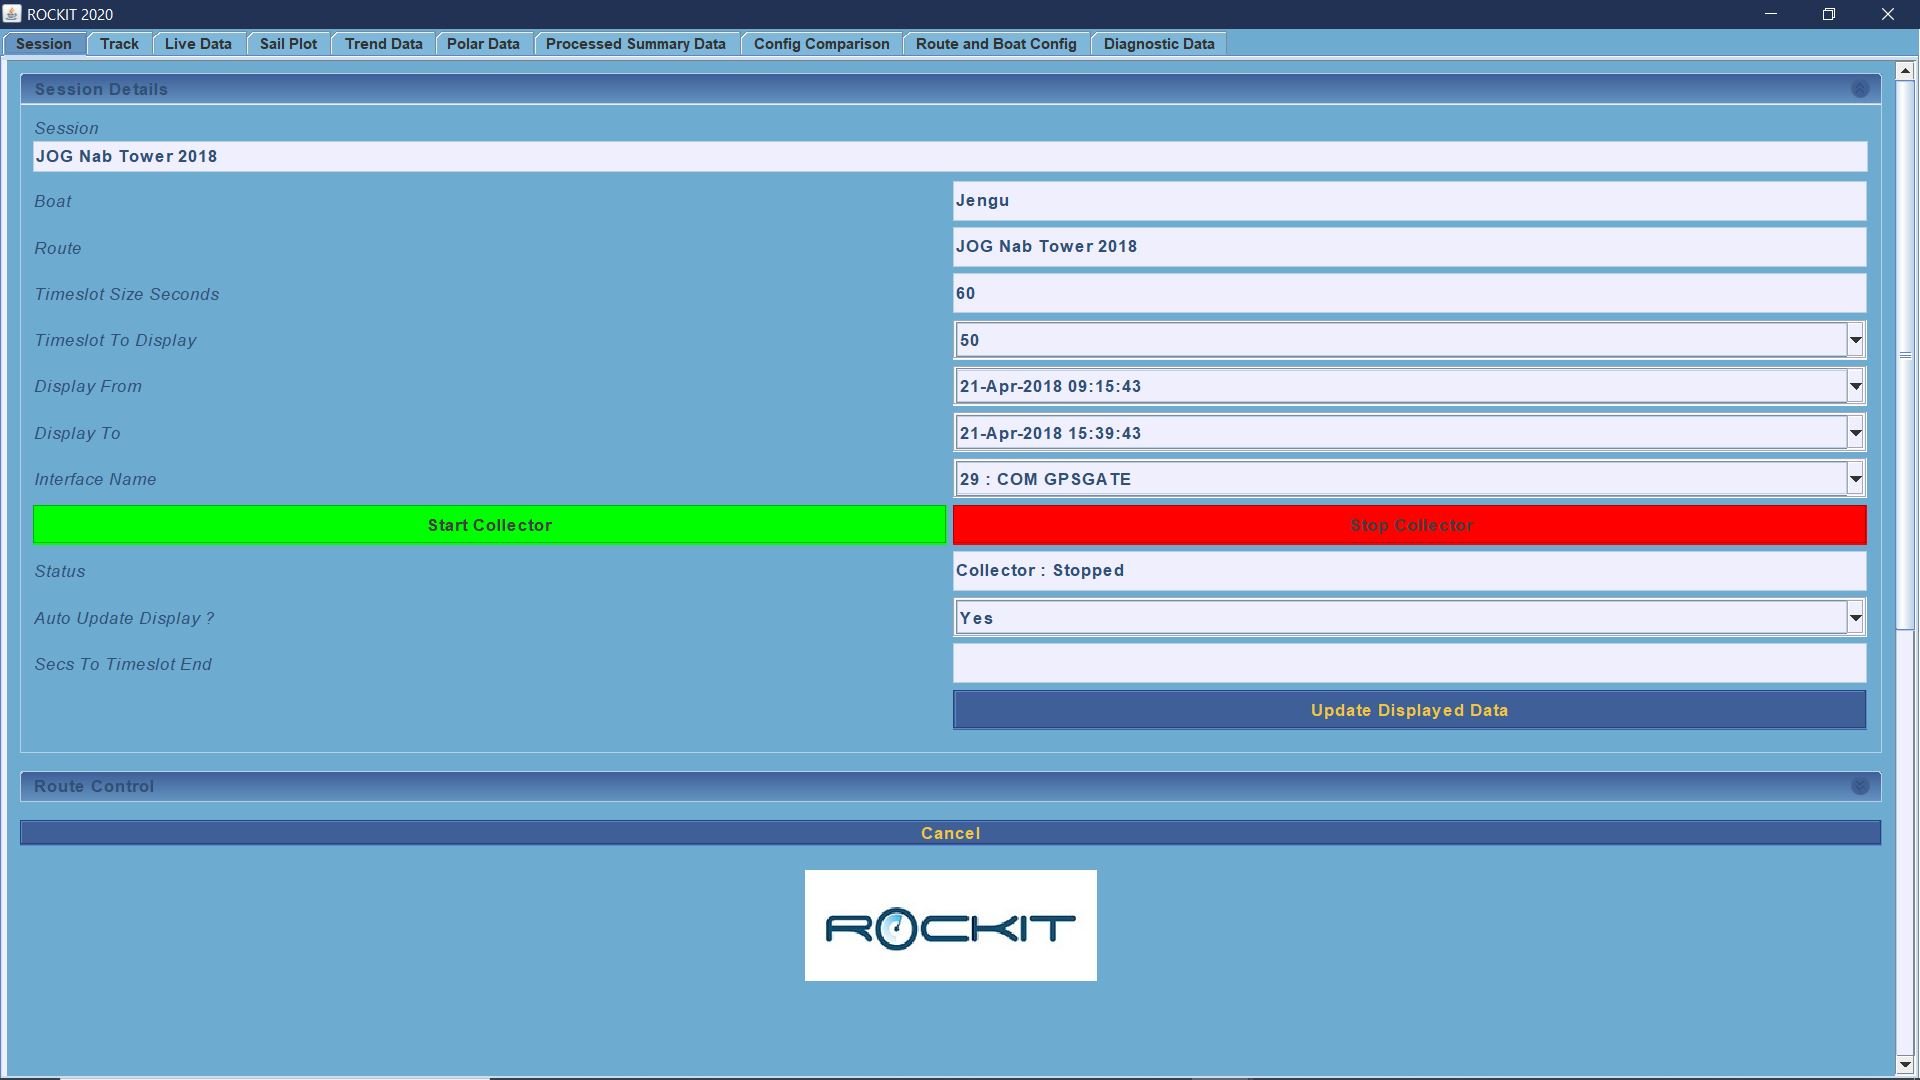
Session Details Panel
The left panel on the Desktop version of the Session Data panel displays basic information about the Session as described in the table below. This is the equivalent to the Session Details tab on the Rockit Server Session Data form. The key difference between the Server and Desktop version is that the Server version is used to control the collection of data whilst the Desktop version is used to control the the range of data display (start and end time).
| undefined | Description | Desktop Editable | Controls Collection Process | On Server Panell | On Desktop Panel |
|---|---|---|---|---|---|
| Session | Session Description | No - Editable on the Session List | No | Yes | Yes |
| Boat | Boat Name | No - Editable on the Session List | Yes | Yes | Yes |
| Route | Route Name | No - Editable on Session List | Yes | Yes | Yes |
| Timeslot Size Seconds | Siz of the timeslots currently set for this Session | No - Editable on Session List | Yes | Yes | Yes |
| Display From | The time to start displaying data from. Allows restriction of data displayed to a set time range | Yes - Press Update Displayed data to update display once this value has been changed | No | Yes | Yes |
| Display To | The time to start displaying data from. Allows restriction of data displayed to a set time range | Yes - Press Update Displayed data to update display once this value has been changed | No | Yes | Yes |
| Interface Name | The name of the interface used to collect the data. | No - Editable on the Session List | Yes | Yes | Yes |
| Start Collector | Button to start data collection process | Yes - Can start collection | Yes | Yes | No |
| Stop Collector | Button to stop collection process | Yes - Can stop collection process | Yes | Yes | No |
| Status | Displays current collection status | No - just for information | Yes | No | 0 |
| Auto Update Display | Turns off auto updating the display panels while collecting data. This can improve performance.the | Yes - changes the way the screens behave | Yes | No | 0 |
| Secs To Timeslot End | Number of seconds to the end of the timeslot when the screen will autoupdate | No - information only | Yes | No | 0 |
| Update Displayed Data Button | Will update all the Tabs on the screen | No | Yes | Yes | 0 |
So what is displayed ?
The Rockit Session Display screen has 10 Tabs on the Server version 7 on the Desktop version.
The table below details the different sets of information. With a few exceptions most of the tabs contain one or more Panels. The data displayed on those Panel is described in the following section.
| Tab | Desktop | Server | Description |
|---|---|---|---|
| Track | No | Yes | This plots the boats track on a basic map display. The track is annotated and coloured based on the boats performance during the previous sample period. |
| Sail Plot | Yes | Yes | This will plot sail usage against boat and wind speed. |
| Trend Data | Yes | Yes | This allows the summary data to be plotted in Time Series form. So you can see how the wind/boat performance indicators evolve over the length of the session. |
| Polar Data | Yes | Yes | This plots boat performance against true wind speed in boat tabular and graphical form. |
| Processed Summary Data | Yes | Yes | This is a rolling view of the summary data. It displays information about the boats performance in each period. This relates the Boat Config Information to the summary data points being calculated. So, you can relate the name of the helm to the boat speed and so forth The summary data is aggregated based on the timeslot size setup in the Recording Session. |
| Route and Boat Config | Yes | Yes | This tab contains information about the boats current configuration and makes it possible to amend the current active items. So if you change sails you can set the new one to active and the old one to inactive. This tab also contains the details of the route. So if you reach a Waypoint in Rockit or change the waypoint you are going towards you can set the next active waypoint. |
| Diagnostic Data | Yes | Yes | This contains a number of tables showing the information that Rockit is collecting for the session; 1) The Data Log; this shows the NMEA sentences being received and the calculations that they are triggering 2) Live Data; this is effectively a basic instrument display showing the different data values extracted from the NMEA Sentences; True Wind Speed, COG, SOG etc. 3) NMEA Data; this is the list of the NMEA data saved to the Rockit database for this session. This is useful when reviewing the boats session performance. Rockit will exclude erroneous NMEA data but occasionally “valid” values will be extreme outliers and go through. You can use this panel to search for and delete those values. 4) Bulk Boat Config Edit; Makes it possible to edit the Boat Config information after it has been recorded. |
| Session Control | No | Yes | Session control shows the definition of the current recording session and allows you to stop, start and test recording. |
| Combined Track, Live Data and Config Comparison | Yes | No | Displays the Track, Comparison Information and Live Data on a single Tab |
| Live Data | No | Yes | Show graphics and numbers to display either the currently received data or the data at a given point on the Track Panel Map |
| Config Comparison | No | Yes | Shows boat configuration information for the peak boat speed for a given wind angle. |
Track Tab
The Track tab on the Rockit Server just contains the Track. Live Data and Config Comparison are separate tabs. On the Rockit Desktop the Track Panel, Live Data Panel and Config Comparison are displayed on the same panel and can be resized based by dragging the panel borders around.
Track Panel
The track panel displays a simple coastline map with the track of the boat superimposed on it.
The track is made up of a series of dots or circles each representing the end point for a Sample Period. The segments linking dots are coloured based on the boats through the water speed relative to the polars for the boat. The colour takes into account the true wind angle, the true wind speed and water speed to colour the track. Purple is the best; generally the max value for the boat or equal to the max value for the boat. The Track menu on the left-hand side of the panel can be used to turn data options on and off. So, in the image above the Waypoint within the route are being displayed,
Waypoints have a green square symbol. The water depth and water speed are also being displayed. Labels are displayed every so many dots to avoid cluttering the screen. Waypoints may also not display if they with be overlaid by other labels. You can adjust the frequency of the labels using the Data Label Frequency number field. 1 implies the data labels will appear next to all dots; 5 implies they will appear every 5 dots. When you have checked/unchecked the checkboxes on the menu you need to press the Update Track button to make the screen reload with the changes.
The Pan Up/Down/Left/Right buttons allow you to move around the map. Zoom in/Zoom Out is the Zoom control. Reset Zoom will reset the Zoom to the original proportions.
Live Data Panel
The Live data panel provides a visual representation of the data that is either currently being recorded, where the Rockit Server is recording or the data for a specific point on the Track Panel.
Config Comparison Data Panel
Rockit knows for each True Wind Speed and True Wind Angle the time at which the test boat has performed best. So it can pull back the boat configuration and related summary data at that point in time.
The Rockit Server screen behaves slightly differently to the Rockit Deskop. For the Server version the Comparison Panel displays this information when a point is clicked on the Track Panel on a separate Config Comparison Tab.
Obviously this will only be able to retrieve data where there is a timeslot with corresponding True Wind Speed and Angle values.
Sail Plot Tab
The sail plot panel will pull the data from Sample Periods for a given sail then plot the boat speed against a wind speed. The result is a scatter graph showing the performance envelope for one or more sails.
So; in the above screen shot we are plotting the boat speed against true wind speed for two sails, A1.5 and A2. We add a linear regression line to the plot for each sail to show the point at which the sails profiles cross. So, based on the data displayed it makes sense to fly the A2 in anything above 5 knots of wind -> the Yellow A2 regression line is higher than the Green A1.5 regression line.
Toggling the check boxes on the Sail Menu allows you to amend the information displayed. You can display the information at both Boat and Recording Session level. The more data you have the more reliable the data plot is likely to be.
Trend Data Tab
The Trend Data Panel is there to do exactly that, show what the current trends are.
The Tab is split into two halves; The left section controls the variables displayed on the graphs. The right section displays the three time series graphs.
The Max Records to Display drop list on the Session Control panel controls the number of Sample periods to display. 100 will display the previous 100 periods; 1000 the previous 1000
in the session. To add/remove a variable from a graph select the checkbox on the Graph Control Menu.
The Table Below lists the variables displayed.
| Variable | Applies to Graph | Description | Abbreviation |
|---|---|---|---|
| Apparent Wind Speed Knots | Value Versus Time | Average apparent wind speed in Knots for a given Sample Period. This is the effective wind speed across the deck. | AWS |
| True Wind Speed Knots | Value Versus Time | Average true wind speed in Knots for a given Sample Period. This is a calculated figure based on the boats Speed Over Ground, Apparent Wind Direction and Apparent Wind Speed. Port tack numbers will be negative starboard tack positive. | TWS |
| Speed Through Water Knots | Value Versus Time | Average speed through the water in Knots for a given Sample Period. This is the figure derived from the boats log sensor. | STW |
| Speed Over Ground Knots | Value Versus Time | Average speed over the ground in Knots for a given Sample Period. This is based on the GPS data. | SOG |
| Velocity Made Good Knots | Value Versus Time | Average velocity made good in knots for a given Sample Period. Note this is the VMG towards the currently defined waypoint rather than the ground made to windward or leeward. | VMG |
| True Wind Direction Degrees Relative to True North | Wind Boat Heading | Average true wind direction relative to true north. This is the direction that the ground wind is coming from. It’s an average so the impact of shorter term shifts will be minimised, more so if a long Sample Period is used. | TWD |
| Course Over Ground Degrees Magnetic | Wind Boat Heading | Average course over the ground degrees magnetic for the Sample Period. The GPS derived course over the ground figure. This figure when combined with the Average course of ground gives an indication of the impact of leeway and a cross tide. | COG |
| Boat Heading Degrees Magnetic | Wind Boat Heading | Average boat heading degrees magnetic for the Sample Period. This measure is the direction that the boat is pointing in, as opposed to the COG which is the direction that the boat is actually going. This requires a fluxgate compass to be connected to the boats network. | HDG |
| Bearing to Next Waypoint Degrees Magnetic | Wind Boat Heading | Average bearing to the next waypoint in degrees magnetic. Combine this with the average boat heading degrees magnetic and course over the ground to find a course to steer. | DIST WPT NAUTICAL MILES |
| Apparent Wind Direction Degrees Relative to Bow | Value Versus Time | Average apparent wind direction degrees relative to the bow. This is the wind angle felt over the deck. Though in the strictest sense unless the source system is correctly calibrated this will be the wind angle at the top of the mast where the sensor is. | AWA |
| True Wind Direction Degrees Relative to Bow | Value Versus Time | Average true wind direction degrees relative to the bow. This is a calculated figure based on the boats Speed Over Ground, Apparent Wind Direction and Apparent Wind Speed. Port tack numbers will be negative starboard tack positive. | TWA |
| Depth Below Transducer | Value Versus Time | Depth below transducer in metres | DBT |
| Heel Angle Degrees | Value Versus Time | Heel angle in degrees - Heel to starboard positive/heel to Port negative | HEEL |
| Trim Angle Degrees | Value Versus Time | Fore/Aft trim Angle. | TRIM |
| Bobstay Load | Value Versus Time | Load on Bob stay where sensor is in place in kilograms | BOBSTAY LOAD |
| Forestay Load | Value Versus Time | Load on Forestay load in kilograms where sensor is in place. | FORESTAY LOAD |
| Backstay Load | Value Versus Time | Load on backstay in Kilograms where sensor is in place | BACKSTAY LOAD |
| Jib Sheet Load | Value Versus Time | Load on Jib Sheet in Kilograms where sensor is in place | JIB SHEET |
| Mainsheet Load | Value Versus Time | Load on Mainsheet in kilograms where sensor is in place | MAIN SHEET |
| Vang Load | Value Versus Time | Load on Vang (Kicking strap) in kilograms where sensor is in place. | VANG |
| Cross Track Error | Wind Boat Heading | Cross track error in nautical miles | XTE |
| COG On Alternative Tack | Wind Boat Heading | Estimated course over group on alternative tack. | COG ALT TACK |
| Absolute Apparent Wind Angle | Relative Wind Direction | Absolute Apparent Wind Direction. Positive to starboard/negative to port | ABS AWA |
| Absolute True Wind Angle | Relative Wind Direction | Absolute True Wind Angle relative to the bow.. Starboard positive/Port negative. | ABA TWA |
Polar Data Tab
Polar Data can be at either Boat or Session Level.
Boat Polar data is the max value from all the sessions recorded for a boat for a given True Wind angle/speed.
Session Polar data is the average value to a session for a given True Wind angle/speed.
Session Data Polar Data Graph
Displays plots of the boat speed through the water against true wind speed and true wind angle relative to the bow. The Wind Data is grouped into 5 knot speed bands and 10-degree angle bands. The session value plotted is the average value for the given wind speed/direction/boat speed combination for a session. The number will continue to evolve for the duration of the session. For a given wind speed/direction/boat speed combination corresponding boat values need to have been recorded i.e. if a session has winds only in the 5-10 knots true range and sails just on a beam reach 90 to the wind only those segments will be populated.
Session Data Polar Table
Displays the information from the graphs in table form. This table also pulls in the maximum value currently recorded for the boat. This is displayed in brackets next to the current session value. You can use the arrows on the top right of each panel to maximise or minimise them.
The numeric values are coloured to indicate the sessions level of performance relative to the boats best speeds. So if the Polar values for the session are in the top 10% the text will be green. If its outside the top 30% the text will be one shade of blue if there is not data for the current session the 0 value and best performance in brackets will be another colour blue..
Processed Summary Data Tab
Displays a rolling view of the data with the most recent on the left-hand side of the screen. It shows the summarised data points collected for the last 10, 100, 1,000 or 10,000 sample periods based on the value selected using the Max Records To Display drop list. The first 23 data points (rows) are fixed and generated from the NMEA data collected by the Data Collection process. The remaining data points are extracted from the Boat Configuration settings and reflect the configuration settings at that point in time.
There is a column in the table for each timeslot. This is a useful guide to the raw summary data that sits behind the graphs and tables on the other Tabs. This view gives a good idea of which timeslots any erroneous NMEA data might have arrived in. For instance: if you boat suddenly starts to do 100knots through the water for a timeslot then you have probably received a corrupt piece of data from the source systems.
Note: Rockit has an amount of built in logic to exclude outlying values from the summary data calculation process. In principle the 100knot value should be excluded based if the normal average boat speed is in the 10-12knot range. 100knots is clearly an outlying value.
The next section describes how to review and edit the raw NMEA data.
The boat configuration at the period is recorded on the bottom rows of the panel. In the example above “A1.5” onwards is boat configuration data. Changes to the boat’s configuration made mid-session will be reflected on this table.
Current Boat and Route Configuration Tab
This Tab shows the current configuration recorded for the boat and the route that is being followed. Editing the data on this tab will change the information recorded for the Summary Data.
Current Boat Config Panel
This allows you to set the current active config items. So, for instance, if you want to reflect a change in the boats sail plan you would follow the steps below; To change from using the A1.5 to the A2.
Select the Active Item Flag Field for the currently active row (the A1.5), and use the drop list that appears to set it to “No”
Select the Active Item Flag Field for the new active row (the A2), and use the drop list that appears to set it to “Yes”
Stepping off the record so that the drop list disappears will say the changes to the Rockit database.
You can also edit the Config Item Value by double clicking in the field.
Once you have made your change step off the record to save the change to the database.
This feature is useful for recording things like the current Helmsman. So the config Item Value would go from “Bill” to “John” and that would be reflected in the recorded config item data. Rockit uses this Boat Config Item data as the basis of the information it records for each Sample Period. Effectively it stores a copy of the Boat Config Items state at the point in time of the Sample Period. Retrospectively editing the Boat Config Item information stored against the Sample Periods is possible as part of a bulk edit and is covered later in this document. Note: Sails are defined as Boat Config Items. So our test J109 has a set of 7 sails defined; A1.5, A2, A5, C1, C3 etc.
The sail performance graphs are generated using this information. So boat performance will be extracted for the sample periods where a sail (eg. A1.5) is active. Its clearly important to make sure the correct sails are active for the correct set of sample periods otherwise the sail performance data will be inaccurate. Our approach is to review the sail usage as part of our post race analysis. We compare our track (windward/leeward etc) with the sail data on Boat Configuration Tab on the diagnostics tab later. Where the two don't match up we can edit them using the Bulk Boat Config Edit panel (described later in this guide.

Current Route Waypoints Panel
This shows the route that the boat is set to follow and its current next waypoint.
As with the Boat Config Items you can edit the active status of a Route Waypoint – you can have a Waypoint in the route sequence that is inactive, for instance, because you decided to by pass it
You can also edit which is the next Waypoint. Stepping off the record will save the change to the database.

Diagnostic Data Tab
The diagnostic data tab contains several panels that make it possible to review and edit the data that Rockit has created.
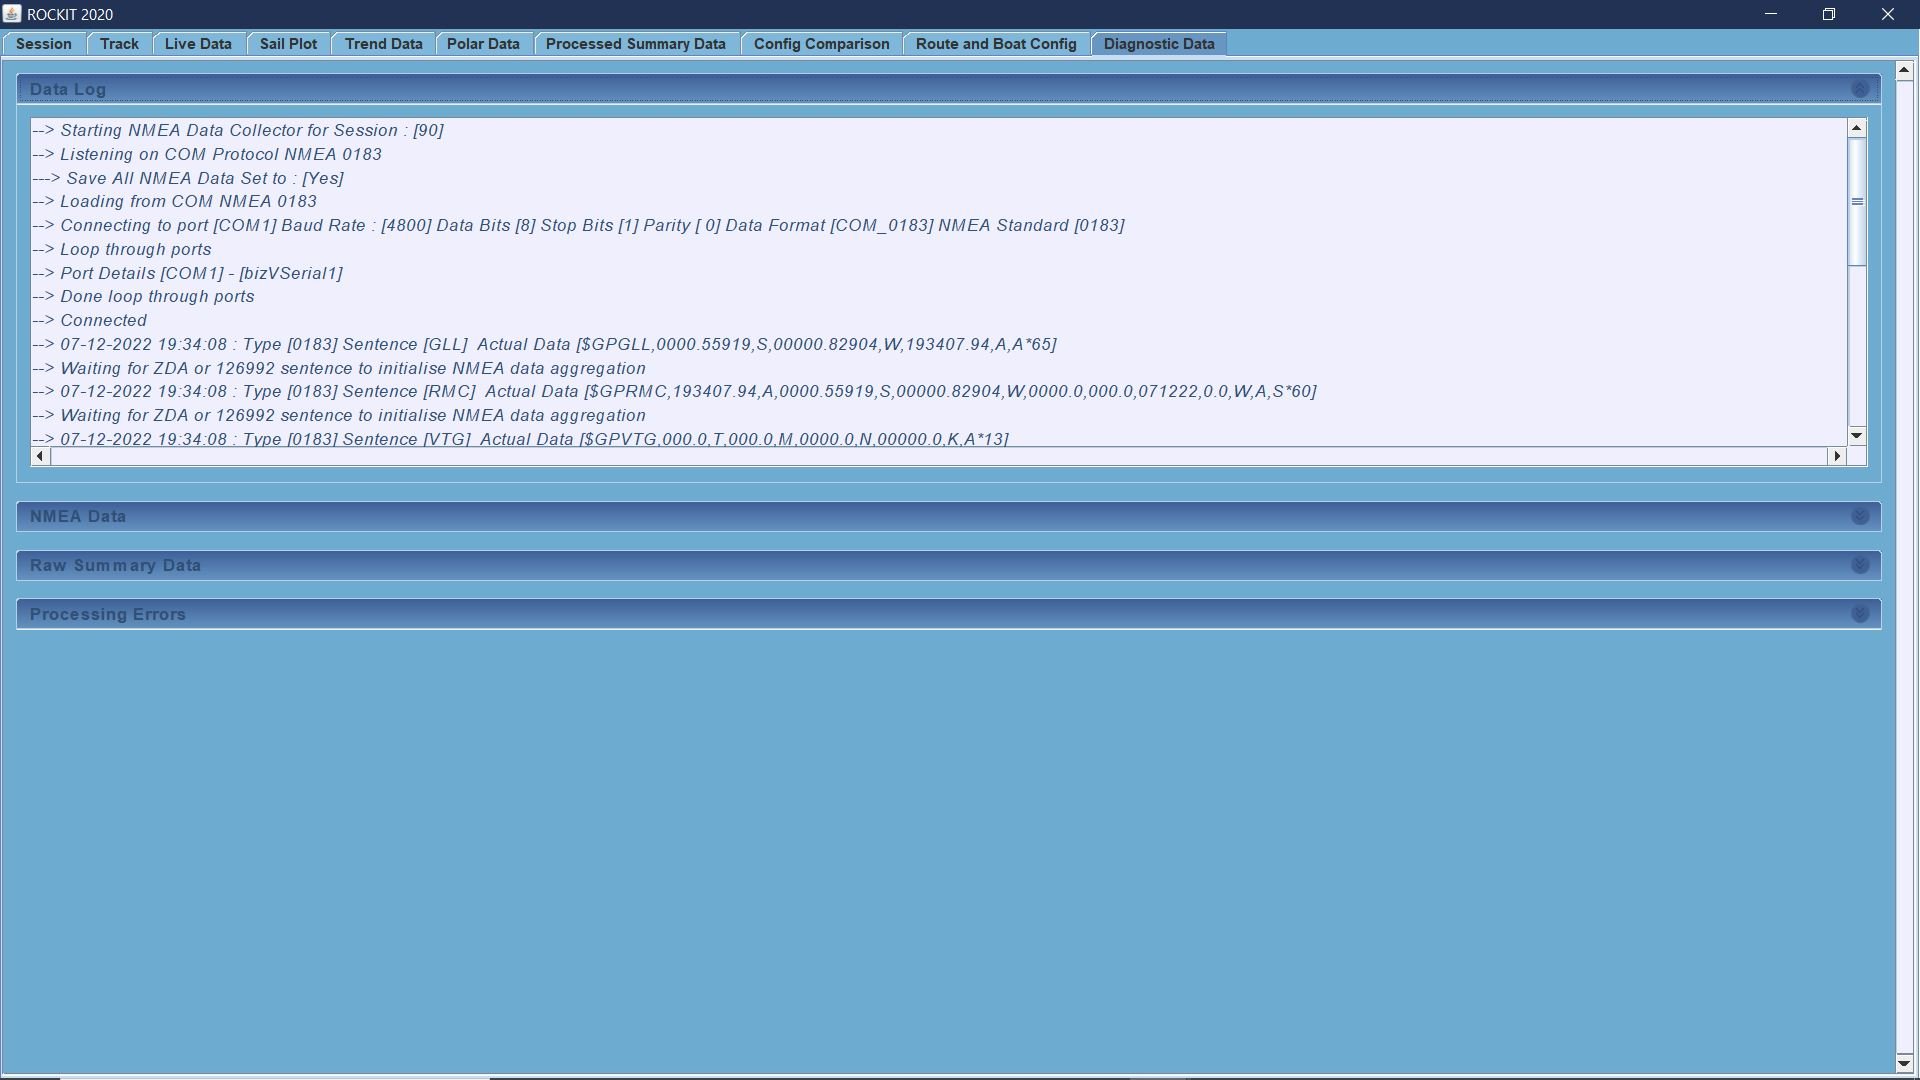
Data Log Panel (Rockit Server only)
This panel shows the data that is currently being processed when by Rockit. It shows the incoming sentences and how they trigger the various calculations.
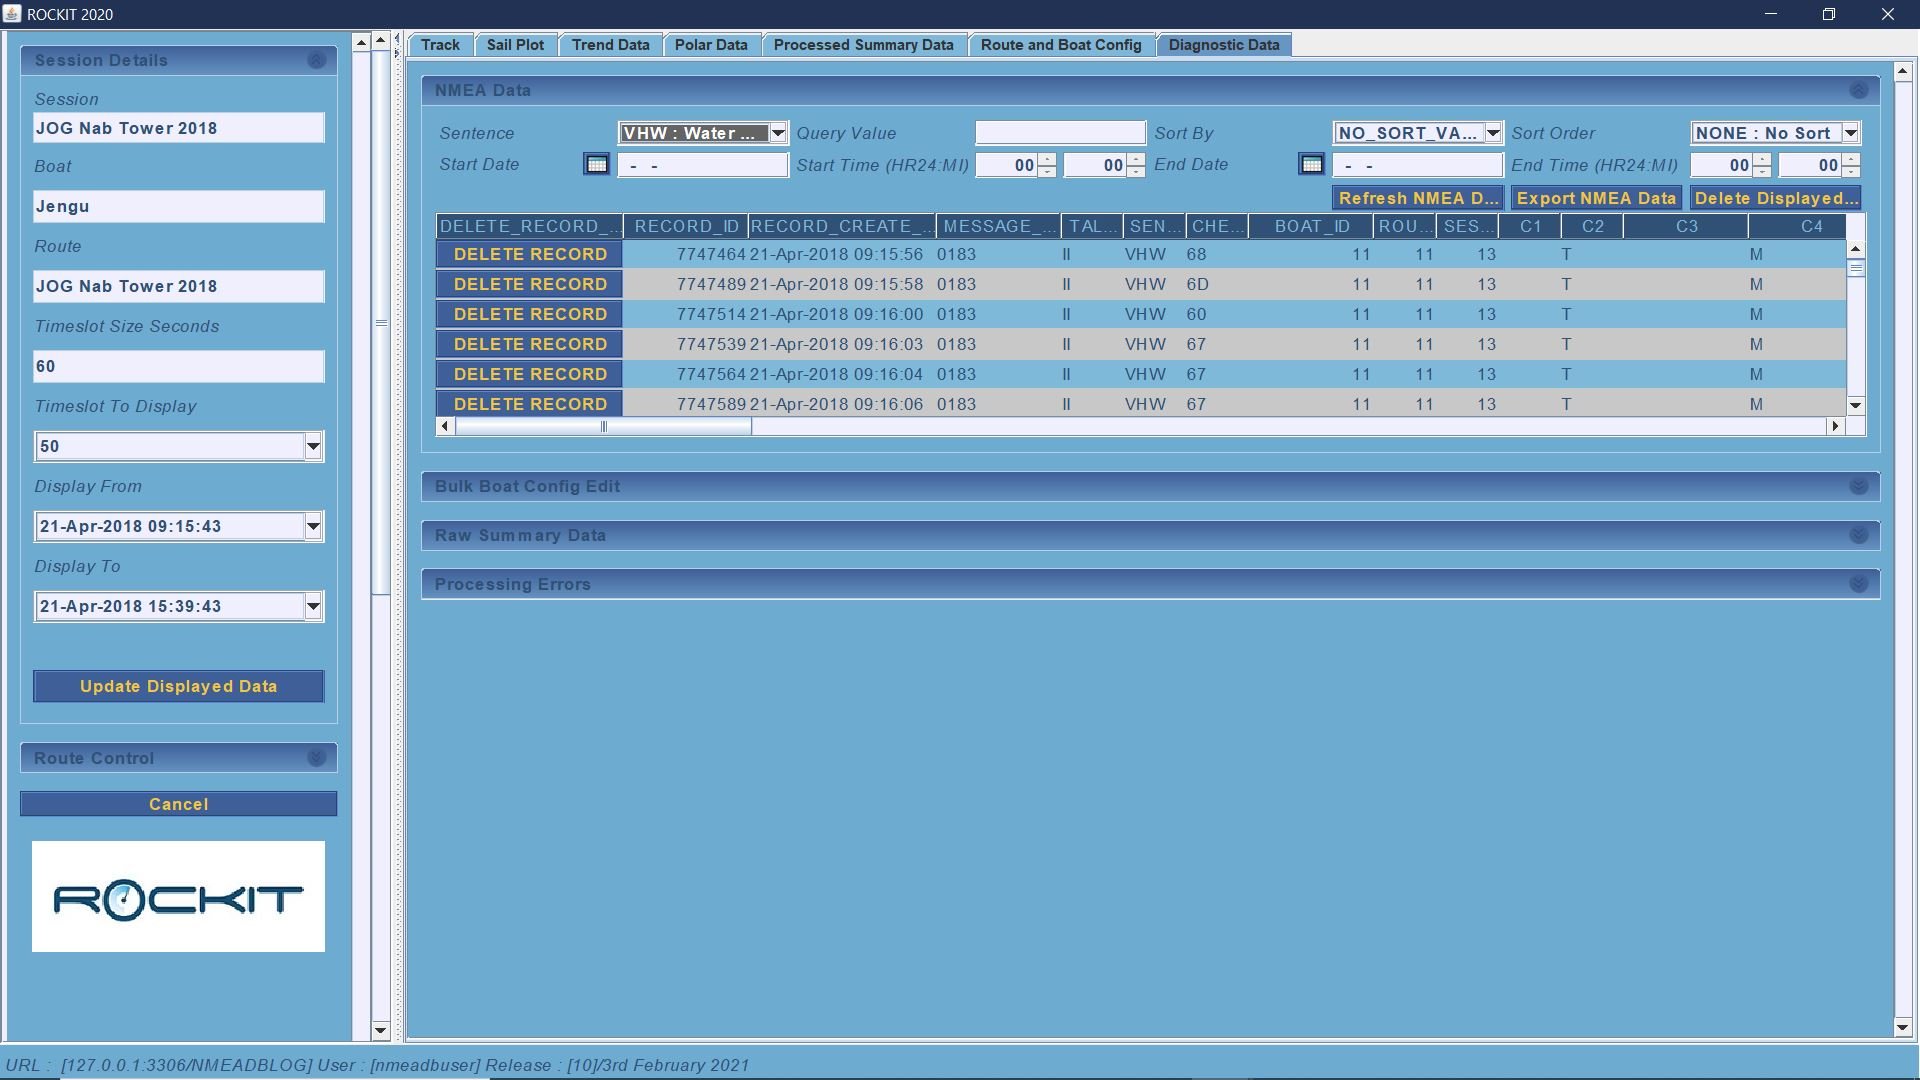
NMEA Data Panel
Displays the information that the Rockit has derived from the NMEA messages received and loaded into its database. Each row in the list represents a single message received.
Rockits NMEA Data table contains basic information about the sentence and a set of fields to represent the data points in the messages, The aim with this table was to collect enough information to drive the calculation process that drives the summary and polar data creation. In theory an NMEA 0183 message can contain up to 50 data points so we should have 50 data columns in the table. In reality we found that the message types we were collecting only required 40 columns maximum.
The Sentence name drop list contains the sentence names that are used in the calculation process. Rockit can be set to run in two modes. One where all the received messages are collected and stored or one that only stores the messages that are required in calculation. Unless you have another use for the data outside of Rockit there isn’t anything to be gained by collecting and storing message types that we don’t use for calculation. There is a parameter value set to force Rockit to collect all inbound sentence data.
The following functions can be applied.
Filter by Message Type. The Sentence drop list at the top of the screen filters the sentence displayed. Only one type of sentence is displayed at a time unless "No Filter" is selected. Once the Sentence has been selected in the drop list the ‘Refresh NMEA Data’ button needs to be pressed to update the data displayed.
Sort By and Sort Order. Use these values to sort by something other than the default sort on the Record ID Column. Sort by is the name of the column to sort by. Sort Order determines whether you are sorting Ascending or Descending on that column.
Filter by Date and time the message is received. The Start Time and End Time can be entered using the dialog boxes. Pressing the Refresh NMEA Data button will then return the message that appear within a specific time period.
Filter by Value. If you know the value that you are looking for you can use the query value field to filter on. As with the previous filter types press the Refresh NMEA Data button to return the filtered records.
Filter by a combination of Time, Value and Message Type. The different filters can be used at the same time to make an even finer grained filter.
Deleting Single Messages. We found on our test boats that occasionally messages would get corrupted and that it was useful to be able to edit or remove the erroneous values. We found that the erroneous data would cause spikes in the Polar and Wind/Boat speed profiles. Pressing ‘Delete’ will permanently remove the record from the database
Deleting All The Displayed Messages. The Delete Displayed Data button will remove all of the currently displayed NMEA records from the database. This is particularly useful if for instance you have recorded data whilst motoring at the end of a session. You can use the time filters at the top of the panel to select the records between a get set of times, then use the Delete Displayed Data to remove all the records for that time span.
Editing Data Values. It’s also possible to edit the individual NMEA message records. Rockit will filter out a lot of data corruption, but some elements will inevitably still get through. Clicking on any of the cells in the table apart from Record ID, Created Time will allow you to edit the value. Having made the change click on another cell in the table to save the data update to the database.
Recalculation Of Summary Data. Once you have removed/edited the values you don’t like you will need to recalculate the summary data. This is achieved using the ‘Recreate Session Summary’ button on the Recording Session screen. If you have a long recording session it can take some time to recalculate all the summary data values. You will not be able to record from the NMEA source until you have finished the recalculation processing.
Bulk Edit Boat Config Data Panel
This panel makes it possible to retrospectively edit the detailed Boat Config Information for each or multiple timeslots;
Use the filters and fields to select the Items that you want to update. Then press the “Bulk Update” button. That will open the actual screen for editing the data. For instance if you want to make the A1.5 active between 9am and 9.30am on the session recorded on 21-April 2018 setup the query panel like that in the image below then press “Refresh Display” to update the displayed information.
That brings up only the A1.5 records.
Press “Bulk Update” to open the Bulk Update Screen.
Set the New Active Flag Value to Yes and press “Set Active Flag”. That will update the Active Item Flag for all the displayed records.
In other circumstances you might want to change the Config Item Name or Value, for instance. for something like the name of the Helmsman. Use the New Value and Change Item Name To fields to do that and press the “Update Item Values” button to apply the new values to the selected records.
Press “Cancel” to close the Bulk Edit screen and “Refresh Display” on the original screen and the values for the Sample Periods Boat Config Items should be updated.


Raw Summary Data Panel
The Raw Summary Data Panel displays the data calculated by Rockit from the incoming NMEA Data feed. Effectively it is a different more limited view of the data on the processed summary data panel. Unlike the Processed Summary Data panel the timeseries runs down the page, each row represents a timeslot. Its is also possible to edit the values on this panel. Whilst its better to perform a complete recalculation of the data, something that is described elsewhere in this guide if you are looking for a short term fix for one of the graphs editing the summary data can be useful.
Making changes to the Raw Summary Data will not affect Polar data for a session or boat as that is requires a complete recalculation of a sessions summary data to affect.
Editing values is simply a question of clicking in the cell for the number that you want to amend, making the change then stepping out of the cells by clicking elsewhere. Clicking out of the cell will force the change to be saved to the Rockit database. Once you have completed the edit use the Update Displayed Data button on the left hand panel to update the information held on the screens.
Additional Functions;
Export Raw Summary Data. You can export the Raw Summary Data as a csv file using the Export Raw Data button.
Update Display. Pressing the update display button will update the screen display.
Recalculate Summary Data (Rockit Server Only). This option will recalculate the sessions summary data.
If you import the NMEA data from another source you will need to run this function to create the summary data once the initial import is complete. Recalculating the summary data can take a very long time but is a very useful function if you want to adjust some of the raw data…. for instance, if you left the engine running at the start of the session. You can delete the Raw NMEA that you don’t like and use this function to recalculate the summary data.
Similarly, if you add a new config item to a boat’s definition after a recording session you will need to reconcile the boat – session config data before it will appear on the screen correctly.
See the section of this User Guide on Batch Recalculation to find out how to use a command line interface to recalculate Summary Data.

Processing Errors
A lot of data errors will be picked up in the process of collecting and aggregating the data from the NMEA Messages.
A subset of those will be written to the a table called Debug Event. This list of errors for a session can be viewed on the Processing Errors panel.
Most of the errors are quite technical. If you are experiencing difficulties collecting data then the explanation is likely contained on that panel. You can Export the rows for a session using the Export Processing Errors button that will create a csv file of the errors that can be sent to Rockit support via email. Email support@ashtree-marine.com
A note on Purging Debug Events. Over time the Debug Event table can get very large and that will slow the processing of the Rockit data. You can use the Purge Debug Data button on the Session List Screen - Session Utilities tab to clear all but the most recent data out of the Debug Event table. If there is a lot of data in the table this may take some time. Once deleted the Debug Events cannot be retrieved.

Notes On How To Use The Graphs
If you right click on the actual graph you will get a context sensitive menu appear.
This gives you the option to both save the graph as a .png file, Zoom in and out on the graph axis and so forth.
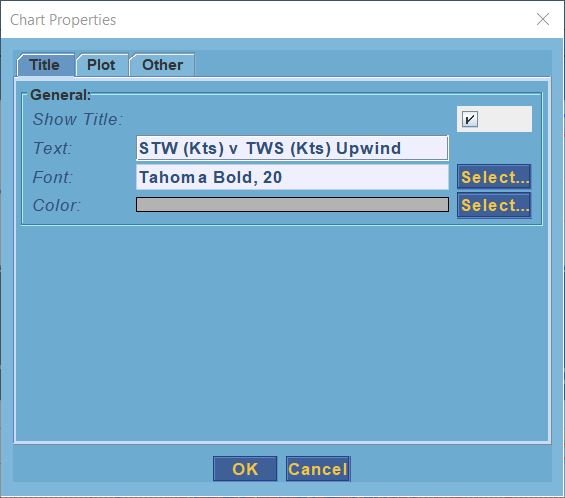
It also gives you the option to modify the graphs visual properties; change the way that the graph is displayed. For instance; you can rotate the axis, change the font, background colour and so forth.
Its worth noting that the original properties will be restored when you update the sail plot the change in appearance is not stored for future use.
Each individual graph panel can be manipulated in this way.